PulseMetrics
A marketing analytics product for agencies, built as a full working demo with a public marketing site and a logged-in client dashboard.
TimeLine
6 weeks
Industry
SaaS / Marketing Technology
Scope
Product UI and marketing site
Visit Site ->

Problems
1
Weekly where-are-we calls
2
Static PDFs lose clients
3
Ad platforms report differently
4
Hours lost to manual reports
Solution
1
Live client-facing dashboard
2
Always-on living reports
3
Normalised cross-channel data
4
One-click export and alerts


WHAT WE GIVE
Features and Developement

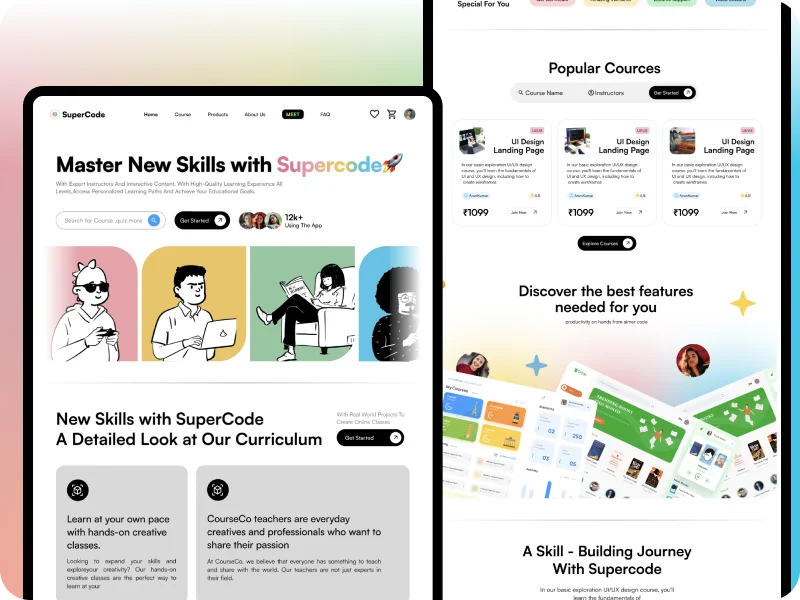
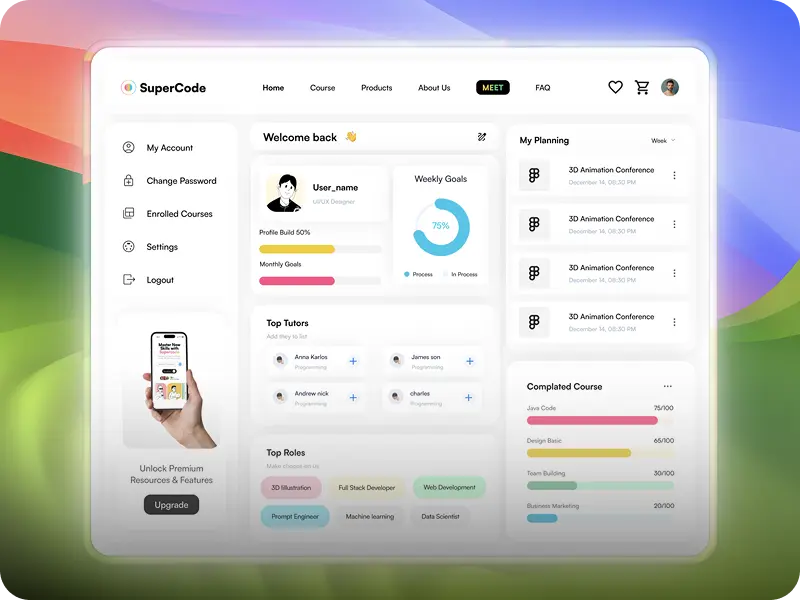
After a one-click demo login you land on a live dashboard. Impressions, clicks, conversions, spend and revenue update in animated cards, with a single chart that switches metric on tap. Clients see the same view their agency does, so the next monthly meeting starts with the data, not catching up on it.
The campaigns tab lists every active campaign with spend, impressions, clicks, CTR, conversions, CPA, revenue and ROAS, broken down by channel and sortable by any column. The wins are obvious, the losers are obvious, and the conversation moves from explaining numbers to deciding what to do about them.


The Reports tab generates a branded PDF of the current view in under a second. The same charts, the same date range, the same client logo, ready to send. Hours of monthly deck-building turn into a single button, which is the kind of detail that pays for the rest of the product.
View MORE
Related Works


Boost productivity
Craft your future ready product now!
Ready to take the next step? Join us now and start transforming your vision into reality with expert support.
